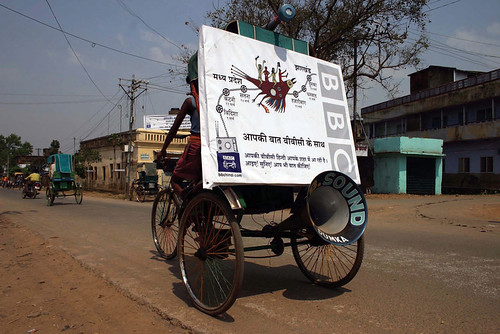
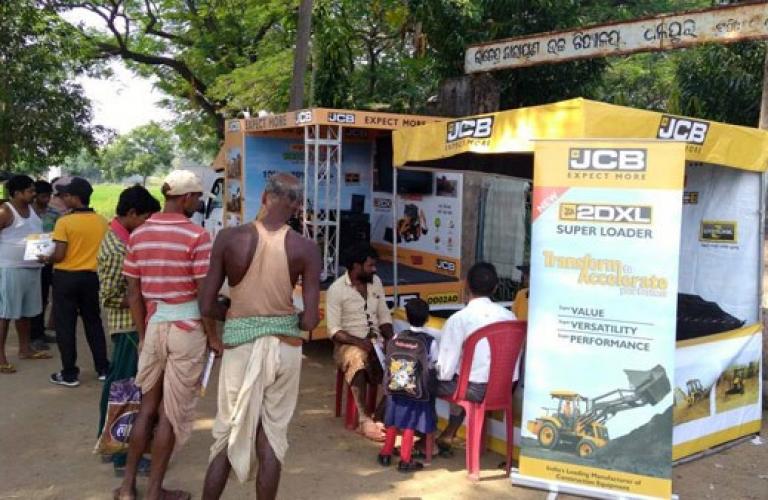
Since rural marketing remain uncertain when compared to urban localities, performance measurement also cannot be produced in limited time periods. Sustained presence in market is the key to perform in Indian villages and performance can only be verified with sales data in hand for ample period.
Measuring the performance of rural marketing is indeed more complex than in urban markets due to the unique characteristics and uncertainties of rural areas. While traditional metrics can be applied, a sustained presence and long-term analysis are essential for accurate performance evaluation. Here are several methods to measure the effectiveness of rural marketing:
1. Sales Data Analysis
The most direct and reliable way to measure rural marketing performance is through sales data. Comparing sales figures before and after marketing campaigns can provide clear insights into their impact. Tracking sales over an extended period helps account for the slow uptake and long decision-making cycles often seen in rural areas.
2. Market Penetration and Reach
Evaluating how deeply and widely the product has penetrated the rural market is crucial. This can be measured by:
- Distribution Metrics: Number of retail outlets carrying the product.
- Geographical Spread: Number of villages or rural areas covered.
- Product Availability: Frequency and consistency of product availability in rural shops.
3. Consumer Feedback and Surveys
Conducting surveys and collecting feedback directly from rural consumers provides valuable qualitative data. This can include:
- Brand Awareness: How well consumers recognize and recall the brand.
- Perception Studies: Consumer opinions and attitudes towards the product.
- Satisfaction Levels: Customer satisfaction and likelihood of repeat purchases.
4. Engagement Metrics
Assessing the engagement levels in various marketing activities can indicate campaign effectiveness. This includes:
- Event Participation: Number of attendees at village fairs, haats, and roadshows.
- Sample Distribution: Quantity of samples distributed and the follow-up purchase rate.
- Interactive Sessions: Engagement during street plays, folk performances, and live demonstrations.
5. Dealer and Distributor Feedback
Input from local dealers and distributors can offer insights into market dynamics and campaign performance. This includes:
- Stock Movement: Rate at which products are ordered and restocked.
- Sales Trends: Patterns and shifts in sales over time.
- Challenges and Opportunities: On-ground challenges faced and potential opportunities for improvement.
6. Brand Loyalty and Repeat Purchase Rate
Tracking the repeat purchase rate and customer loyalty over time helps gauge long-term campaign success. This can be measured by:
- Loyalty Programs: Enrollment and participation in loyalty programs.
- Repeat Orders: Frequency of repeat purchases by existing customers.
- Referral Rates: Number of new customers acquired through word-of-mouth.
7. Digital Analytics (if applicable)
For digital marketing efforts, leveraging analytics tools can provide detailed insights. This includes:
- Social Media Engagement: Likes, shares, comments, and reach on social platforms.
- Website Traffic: Number of visits, duration, and behavior of rural users on the brand’s website.
- Mobile Marketing Metrics: Response rates to SMS campaigns, WhatsApp messages, and other mobile marketing efforts.
Society Gate Ad locations in Delhi


